
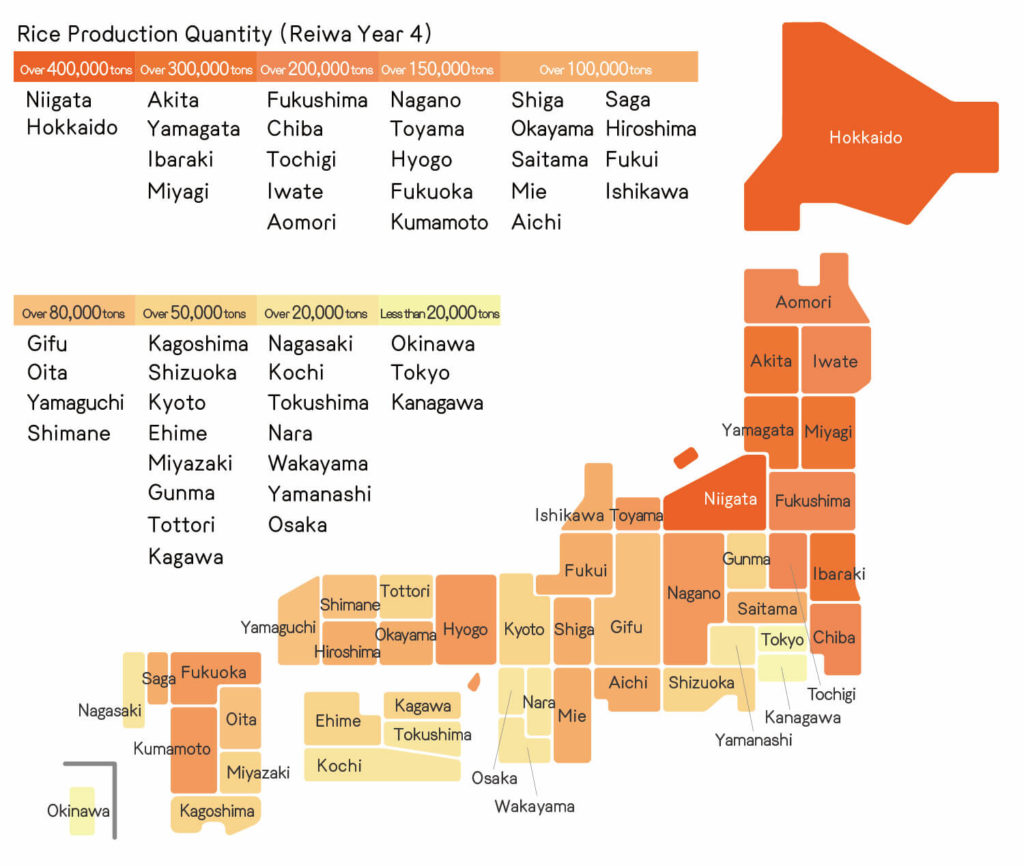
Rice is one of the few agricultural products cultivated across various regions in Japan, adapting to the climate of each area.
| National Agricultural Regions and Prefectures | Area Planted for Staple Food (ha) | Staple Food Harvest Quantity (t) |
|---|---|---|
| Nationwide | 1,251,000 | 6,701,000 |
| hokkaido | 82,500 | 487,600 |
| aomori | 33,900 | 201,400 |
| iwate | 43,700 | 234,700 |
| miyagi | 57,000 | 306,100 |
| akita | 69,100 | 382,800 |
| yamagata | 52,700 | 313,000 |
| fukushima | 51,900 | 284,900 |
| ibaraki | 58,300 | 310,200 |
| tochigi | 46,100 | 245,300 |
| gunma | 12,400 | 62,200 |
| saitama | 27,400 | 136,500 |
| chiba | 45,500 | 247,500 |
| tokyo | 115 | 484 |
| kanagawa | 2,880 | 14,400 |
| niigata | 99,900 | 543,500 |
| toyama | 31,300 | 174,000 |
| ishikawa | 20,700 | 110,100 |
| fukui | 21,600 | 111,200 |
| yamanashi | 4,690 | 25,000 |
| nagano | 29,800 | 181,200 |
| gifu | 20,000 | 97,400 |
| shizuoka | 15,000 | 76,400 |
| aichi | 25,200 | 127,300 |
| mie | 25,200 | 128,800 |
| shiga | 27,700 | 144,900 |
| kyoto | 13,400 | 68,900 |
| osaka | 4,540 | 22,800 |
| hyogo | 32,800 | 168,300 |
| nara | 8,350 | 43,600 |
| wakayama | 5,980 | 31,000 |
| tottori | 12,000 | 61,700 |
| shimane | 16,100 | 83,600 |
| okayama | 27,100 | 142,000 |
| hiroshima | 21,100 | 111,800 |
| yamaguchi | 16,600 | 87,300 |
| tokushima | 9,640 | 46,300 |
| kagawa | 10,800 | 55,200 |
| ehime | 13,000 | 68,100 |
| kochi | 10,600 | 48,800 |
| fukuoka | 32,800 | 161,000 |
| saga | 22,300 | 114,600 |
| nagasaki | 10,400 | 48,900 |
| kumamoto | 30,200 | 151,300 |
| oita | 18,800 | 92,700 |
| miyazaki | 13,400 | 65,400 |
| kagoshima | 16,600 | 79,300 |
| okinawa | 604 | 1,820 |
Top 10 Varieties by Planting Ratio Nationwide
| Variety Name | Planting Ratio | Primary Production Areas | |
|---|---|---|---|
| 1st | Koshihikari | 36.4% | Niigata , Ibaraki , Tochigi |
| 2nd | Hitomebore | 9.7% | Miyagi , Iwate , Fukushima |
| 3rd | Hinohikari | 9.2% | Kumamoto , Oita , Kagoshima |
| 4th | Akita Komachi | 7.2% | Akita , Iwate , Ibaraki |
| 5th | Nanatsuboshi | 3.1% | Hokkaido |
| 6th | Haenuki | 2.9% | Yamagata , Kagawa , Akita |
| 7th | Kinuhikari | 2.7% | Shiga , Hyogo , Saitama |
| 8th | Masshigura | 2.0% | Aomori |
| 9th | Asahi no Yume | 1.6% | Tochigi , Gunma |
| 10th | Koshiibuki | 1.5% | Niigata |

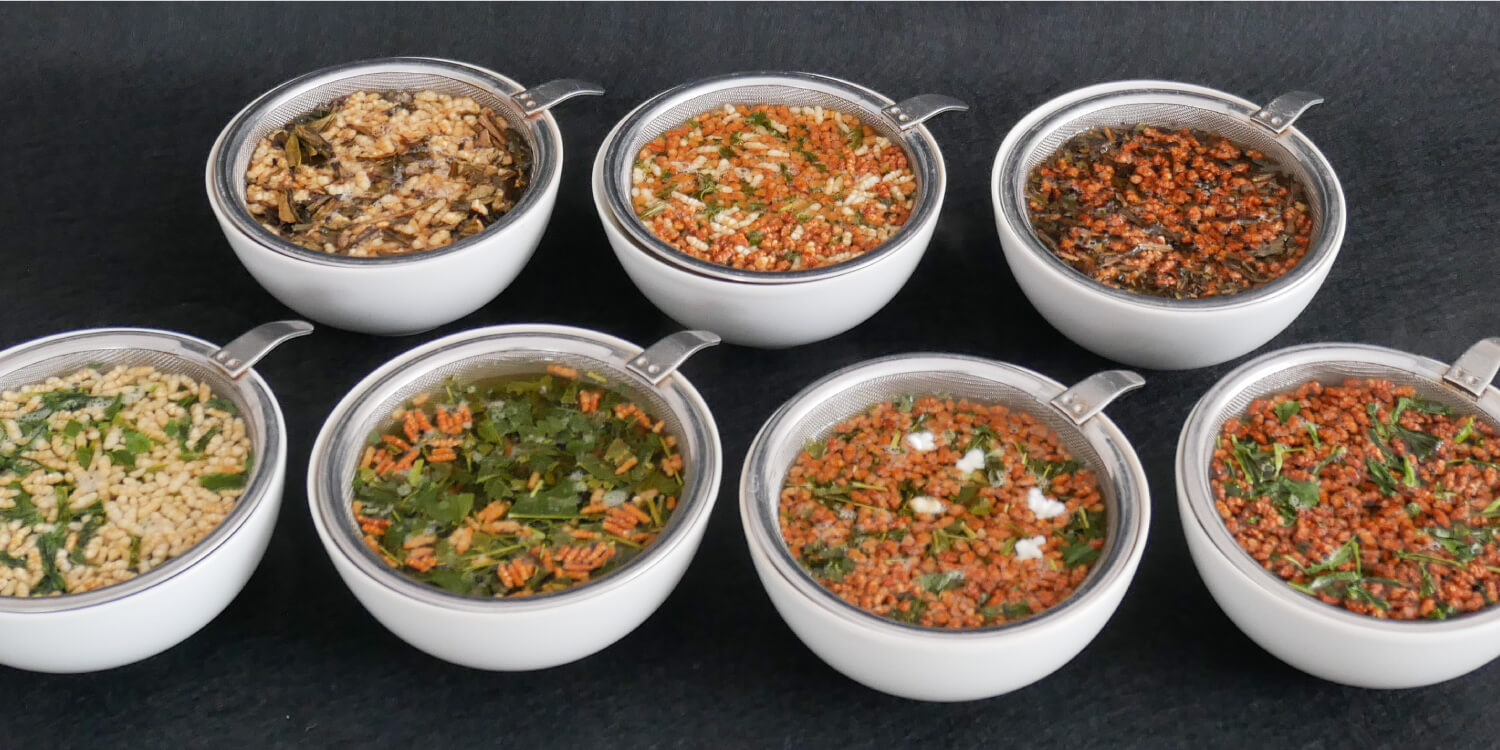
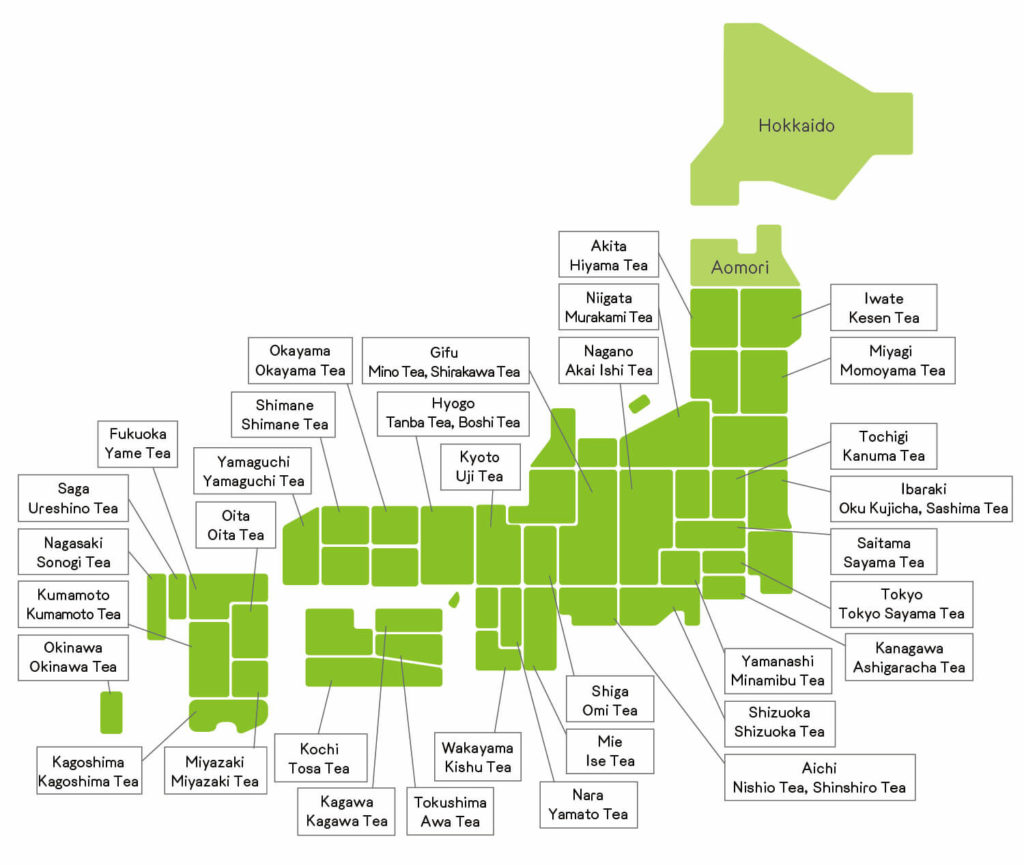
Surprisingly, tea is produced throughout Japan! Some areas in Tohoku also cultivate tea.
*Reference: National Tea Production Federation and National Association of Agricultural Cooperatives in Tea-Producing Prefectures Liaison Council Website
During the Edo period, tea was a precious agricultural commodity, and it was cultivated even in Hokkaido and the Tohoku region. However, tea plants are originally evergreen trees native to subtropical regions, and they are often susceptible to leaf damage from cold and frost. Consequently, in regions where the risk of cold and frost damage overlapped, it was challenging to establish tea plantation management as an industry. Instead, tea cultivation became prominent in warmer climates such as Shizuoka and Kyushu. Therefore, the generally recognized northern limit for the industrial production of tea in our country is a line connecting Murakami Village in Niigata Prefecture and Ogiso Town in Ibaraki Prefecture.
 hokkaido | Within the precincts of Zengenji Temple (Furudaira Town), the tea plants are considered to be at their northernmost point of cultivation. |
aomori | While this has been a known existence for a long time, currently, there is only one household cultivating tea in Moto-machi, Kuroishi City. It is even included in the educational materials for elementary and junior high school students. |
akita | Traditionally known as the northern limit for tea, currently, there is only one household cultivating tea in Hiyama-cho, Noshiro City. |
iwate | It is said that in the 18th century, seeds were brought back and cultivated during pilgrimages to Ise, and now tea is grown and produced in places like Rikuzentakata City and Ofunato City. |
yamagata | In Tsuruoka City’s Haguro-cho, Shonai-produced tea returns after 140 years. The Matsugaoka reclamation area in the same town newly planted tea in Heisei 21 (2009) and harvested it for the first time in 23 years, aiming for “Matsugaoka Tea.” |
miyagi | It is said that Sendai Domain encouraged tea cultivation for industrial development, and currently, tea is cultivated mainly in Momodai-cho, Ishinomaki City, and sold as a regional specialty. Tea gardens can be seen scattered along the foothills of the surrounding areas. |
niigata | Generally, a line connecting Murakami City in Niigata Prefecture and Ogiso Town in Ibaraki Prefecture is considered the northern limit for tea production to be established as an industry. Tea is primarily cultivated in Murakami City, and the tea gardens are designed to withstand snowfall. It is known for its sweetness. |
While tea plants exist in Hokkaido, cultivation occurs in Aomori, and according to data from the Ministry of Agriculture, Forestry, and Fisheries, it generally becomes an established industry in Niigata.
Data from the 2nd year of Reiwa
| National Agricultural Areas ・ Prefectures | Annual Total | ||||
| Harvested Area (Actual Area)(ha) | Total Harvested Area (ha) | Yield per 10a of Fresh Leaves (kg) | Fresh Leaf Harvest (t) | Rough Tea Production (t) | |
| Nationwide | 34,300 | 77,800 | 959 | 328,800 | 69,800 |
| hokkaido | – | – | – | – | – |
| aomori | x | x | x | x | x |
| iwate | x | x | x | x | x |
| miyagi | 2 | 2 | 300 | 6 | 1 |
| akita | x | x | x | x | x |
| yamagata | x | x | x | x | x |
| fukushima | x | x | x | x | x |
| ibaraki | 156 | 329 | 718 | 1,120 | 260 |
| tochigi | 6 | 7 | 333 | 20 | 5 |
| gunma | x | x | x | x | x |
| saitama | 610 | 919 | 570 | 3,480 | 754 |
| chiba | 22 | 26 | 350 | 77 | 18 |
| tokyo | 43 | 64 | 467 | 201 | 41 |
| kanagawa | 131 | 215 | 508 | 666 | 146 |
| niigata | 13 | 20 | 231 | 30 | 8 |
| toyama | x | x | x | x | x |
| ishikawa | 4 | 4 | 112 | 4 | 1 |
| fukui | 1 | 1 | 216 | 2 | – |
| yamanashi | 51 | 59 | 304 | 155 | 31 |
| nagano | 24 | 24 | 254 | 61 | 13 |
| gifu | 457 | 793 | 473 | 2,160 | 470 |
| shizuoka | 13,700 | 29,000 | 822 | 112,600 | 25,200 |
| aichi | 425 | 675 | 854 | 3,630 | 744 |
| mie | 2,520 | 5,220 | 952 | 24,000 | 5,080 |
| shiga | 339 | 746 | 814 | 2,760 | 549 |
| kyoto | 1,390 | 2,270 | 806 | 11,200 | 2,360 |
| osaka | – | – | – | – | – |
| hyogo | 41 | 65 | 451 | 185 | 42 |
| nara | 585 | 1,120 | 1,060 | 6,190 | 1,490 |
| wakayama | 16 | 20 | 269 | 43 | 8 |
| tottori | 8 | 22 | 1,080 | 86 | 20 |
| shimane | 69 | 132 | 743 | 513 | 115 |
| okayama | 40 | 61 | 570 | 228 | 51 |
| hiroshima | 7 | 13 | 686 | 48 | 10 |
| yamaguchi | 41 | 99 | 859 | 352 | 72 |
| tokushima | 188 | 196 | 309 | 580 | 118 |
| kagawa | x | x | x | x | x |
| ehime | 75 | 77 | 268 | 201 | 44 |
| kochi | 188 | 305 | 401 | 753 | 168 |
| fukuoka | 1,480 | 2,620 | 561 | 8,300 | 1,600 |
| saga | 635 | 1,190 | 809 | 5,140 | 1,140 |
| nagasaki | 510 | 830 | 547 | 2,790 | 578 |
| kumamoto | 950 | 1,550 | 568 | 5,400 | 1,120 |
| oita | 438 | 655 | 591 | 2,590 | 549 |
| miyazaki | 1,080 | 3,270 | 1,350 | 14,600 | 3,060 |
| kagoshima | 7970 | 23,100 | 1,490 | 118,400 | 23,900 |
| okinawa | 15 | 26 | 740 | 111 | 24 |
Note: 1.Tea harvest surveys are conducted in the main tea-producing prefectures and are conducted nationwide every six years. The main tea-producing prefectures are those that account for approximately 80% of the national cultivation area in the most recent nationwide survey year and are the prefectures where tea-related projects are implemented through tea field crop insurance and comprehensive support grants for strong agriculture and cultivating human resources. 2.For the 2020 harvest survey, it was conducted nationwide. 3.Yield per 10a of Fresh Leaves is calculated by dividing the fresh leaf harvest by the harvested actual area (first flush tea is the harvested area).